
Find the bottleneck before changing the system
How to turn “the product feels slow” into a testable explanation and a focused engineering decision.
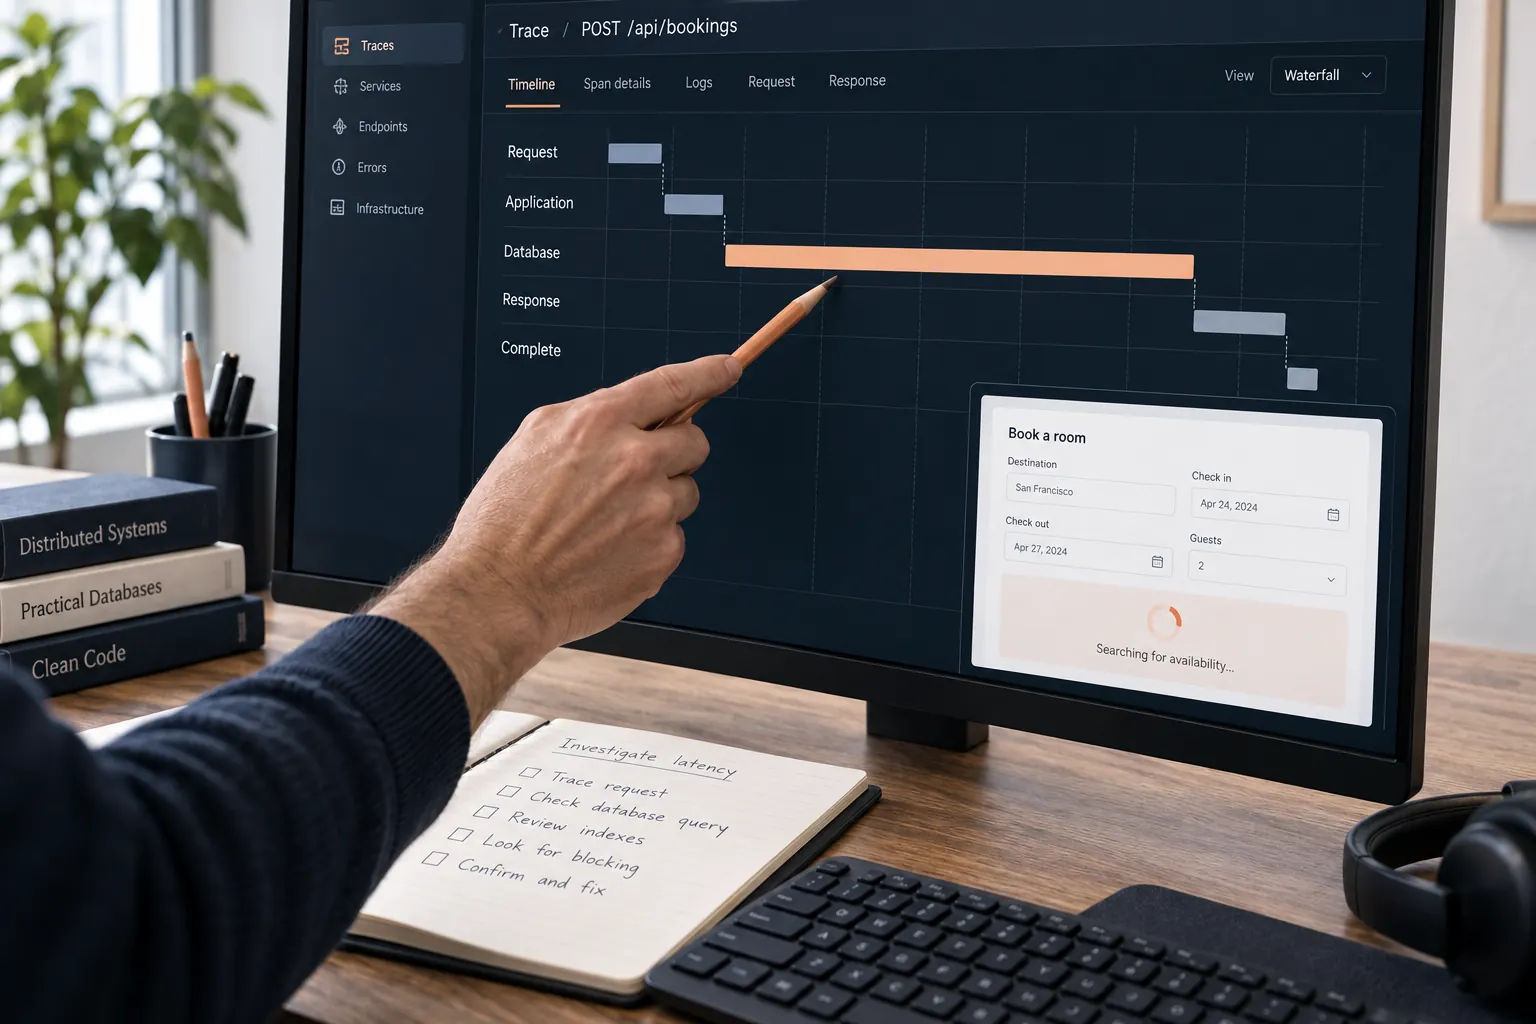
Locate where time and work accumulate, compare like with like and test one explanation at a time.
Give the symptom a precise shape
A customer says the application is slow. That observation matters, but it is not yet a diagnosis. It could describe a delayed page, a long search, a frozen interaction or a task that appears complete but delivers its result much later. Each suggests a different investigation. Start by identifying the action, the affected customer group and the conditions in which the delay occurs.
Record when it began and whether anything changed nearby: a release, a larger import, a new integration or an unusual demand pattern. Correlation is useful for forming questions, but it does not establish the cause. A release can coincide with a traffic increase, and both can expose an older weakness.
Define a measure that matches the complaint. For an interactive search, measure from the user’s action to a usable result where practical. Server processing time answers a narrower question. If the customer waits while the browser downloads and displays a large response, a fast server measurement may be entirely accurate and still miss the problem.
Follow one request through the work
A request often crosses several boundaries: browser, application, database and an external provider. A distributed trace connects timed spans of that work so the team can inspect how one operation proceeds. OpenTelemetry documents this model and the relationship between a trace and its individual spans. The practical value is an explanation of where elapsed time went.
Instrument the important path before attempting broad optimization. Include the waits that occur between components, not just the time spent executing application code. A request may wait for a database connection before it runs a fast query. In that case, optimizing the query alone may not remove the delay.
Be careful about what enters diagnostic records. Identifiers that let engineers connect events can be useful without copying customer documents or credentials into logs. Choose fields intentionally, limit access and retain only what the investigation needs. Observability should make the product easier to operate without creating an unnecessary second store of sensitive information.
Separate averages from difficult cases
An average can conceal the experience that customers are reporting. If most requests complete quickly while a smaller group waits much longer, the overall mean may move only slightly. Look at the distribution and compare affected operations or customer groups. A percentile describes the point below which a stated share of measurements falls; it is not the duration of every request in that group.
Google’s monitoring guidance identifies latency, traffic, errors and saturation as useful signals. Consider them together. Rising delay with a growing queue suggests waiting work. Rising errors with low resource use may point toward an unavailable dependency or a limit elsewhere. A busy processor is a clue, not a complete explanation of why a particular customer journey failed.
Make comparisons over similar windows and workloads. Morning traffic and overnight processing may use the same infrastructure differently. A chart that combines them can hide the relationship you need. Preserve enough context to distinguish a genuine regression from a change in the work being performed.
Test a concrete explanation
Suppose a hypothetical scheduling product becomes slow for customers with long histories. A trace shows repeated database reads while opening a calendar. The team proposes that the application retrieves records one at a time where one bounded query would suffice. This is a specific explanation with an observable consequence: fewer queries should reduce time on that path under comparable data conditions.
For PostgreSQL, EXPLAIN shows the database’s planned approach to a query, and EXPLAIN ANALYZE executes it to provide actual timing and row information. Because the latter runs the statement, use care with writes and expensive queries. An isolated, representative environment is often the right place to investigate first.
Make one meaningful change and repeat the comparison. Record both improvement and possible costs. A new index may improve a read path while adding storage and write work. Caching can reduce repeated computation while introducing questions about freshness. The decision is stronger when the team understands the trade-off instead of reporting a single favorable measurement.
Check the whole journey after the fix
Removing one constraint can expose another. Once a query becomes faster, response transfer or browser rendering may dominate the customer’s wait. That does not invalidate the first fix. It changes the next question. Re-measure the original journey and decide whether the remaining behavior meets the product’s needs before continuing.
Also observe representative demand after release. A local comparison supports the mechanism of the change; live observations show how it behaves in the actual workload. Keep those claims separate in the update to the founder. Include the measurement period and any customer groups not covered.
End the investigation with a decision record that another engineer can use: symptom, evidence, explanation, change and observed result. If the explanation was wrong, preserve that learning too. A good diagnosis reduces uncertainty. It gives the business a reason for the work, a way to judge its effect and a clearer basis for deciding whether further change is worthwhile.
Frequently asked questions
What is the first step in finding a performance bottleneck?
Describe the symptom precisely: which customer action is slow, when it happens and under what workload. Establish a baseline so later measurements compare the same journey and conditions.
Why can average response time hide a problem?
An average can conceal the slow requests that some customers experience. Compare response-time distributions and difficult cases, including unusually large records, concurrent requests and delayed dependencies.
How do I know whether a performance fix worked?
Test the original journey under comparable conditions. Check successful completions and errors as well as response time, and look for work or delays that the change moved elsewhere in the system.